House Price Prediction in California Linear Regression
Using linear regression and gradient descent to predict house prices in California


The full Jupyter notebook for this experiment can be found here.
Objective
The goal of this project is to train a model to accurately predict housing prices in California. This project utilizes some core data analyst / machine learning techniques such as data visualization, data exploration, data manipulation, feature scaling / engineering, linear regression, and random forest model
My hypothesis is that there is a strong correlation between Median Income and Median House Prices. I was curious to see if I could write a model for predicting house prices based on income alone. I have used the popular cost function and gradient descent formulas to pinpoint the most accurate model to predict the house prices.
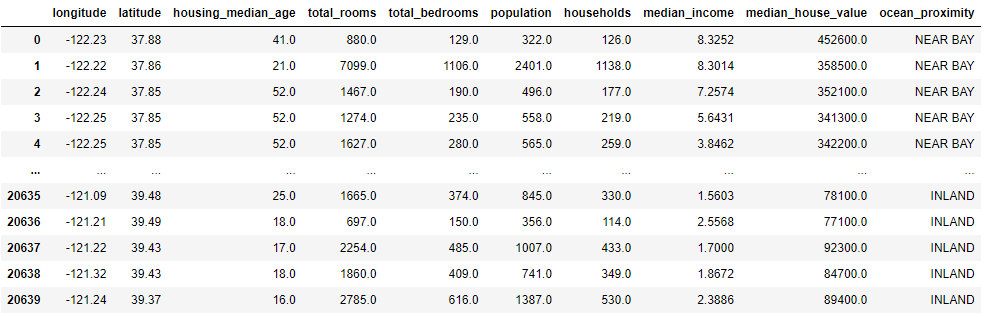
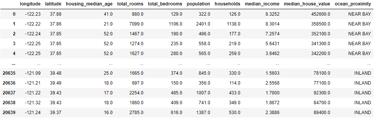
The dataset is found on Kaggle. After parsing, the dataset looks like this:
Exploratory Data Analysis (EDA)
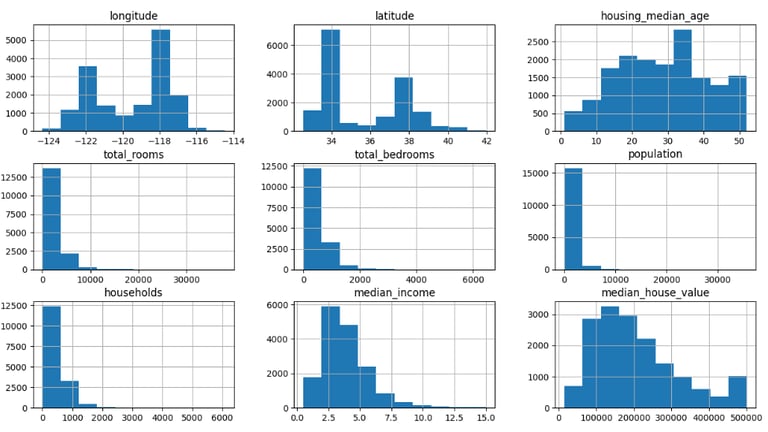
In this phase, I parsed the csv file with pandas and looked into the columns for information. I did some light data cleaning, such as dropping NA values to make the data analysis phase a bit smoother. I noticed some datasets are a bit skewed (like the picture below). So I used numpy's log method to smoothen out the charts to create more coherent data visualizations later on in the project.
The plot below shows the histogram for all features provided:

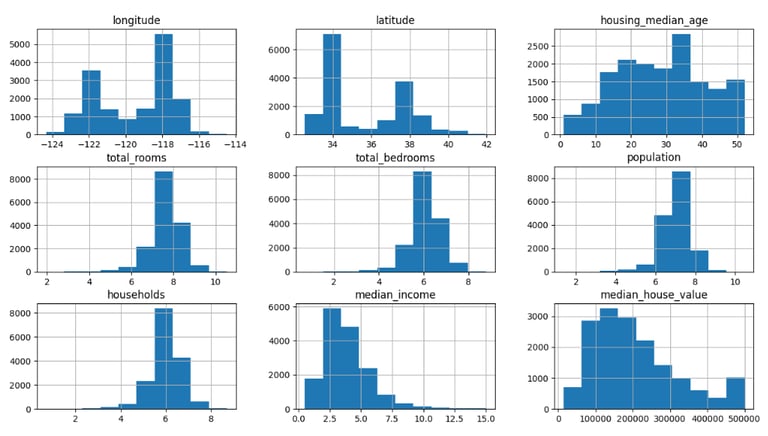
The outcome is a more balanced dataset, as shown in the picture below:

Feature Engineering
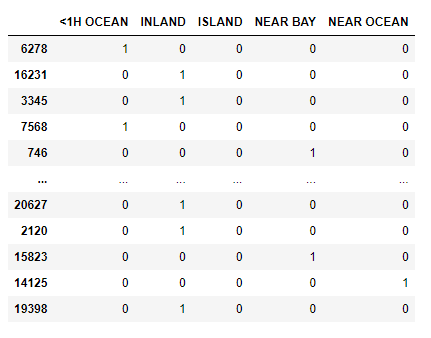
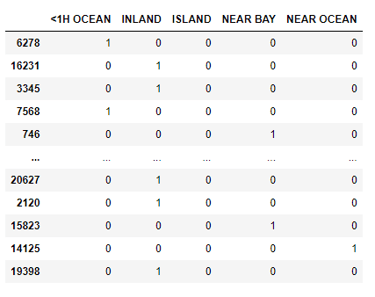
I've turned some data with text into Boolean data points which is much better for capturing the summary of the data. For example, the inland vs. island vs. near bay vs. near ocean was changed to a Boolean instead of the exact distance.
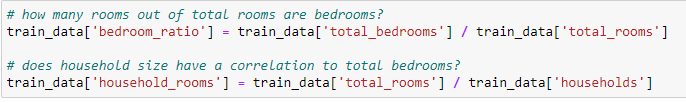
To create a clearer picture of the correlations, I created some new features such as: how many total rooms are bedrooms? and does household size have a correlation to total bedrooms?
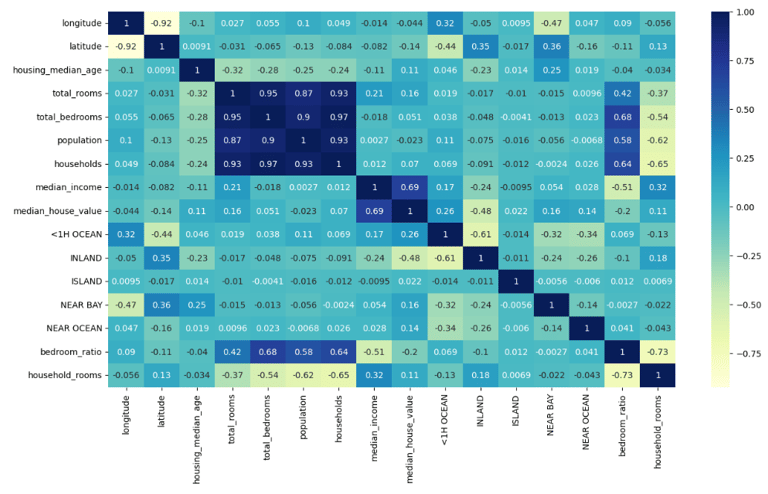
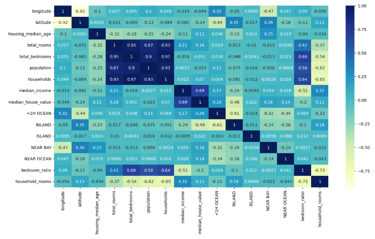
Below, we can see a heatmap with the new features. We can infer that bedroom ratio does indeed have correlation with the total bedrooms in a household.
Linear Regression w/ Feature Scaling+
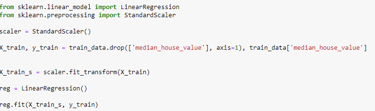
With the help of Sklearn’s Standard Scalar, I've utilized feature scaling to ensure the datasets are much more balanced. This also helps with the linear regression output. The code below is also the model for our linear regression. All we will have to do is to train and test the following model.

Training / Test Split
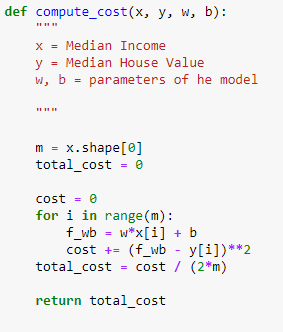
To train and test the data, I decided to split 80% for training and 20% for testing. To accurately find the minimum cost and parameters, I’ve utilized gradient descent by first computing the gradient.

The gradient will tell us the general direction of the minimum cost. After computing the gradient, we can compute the gradient descent
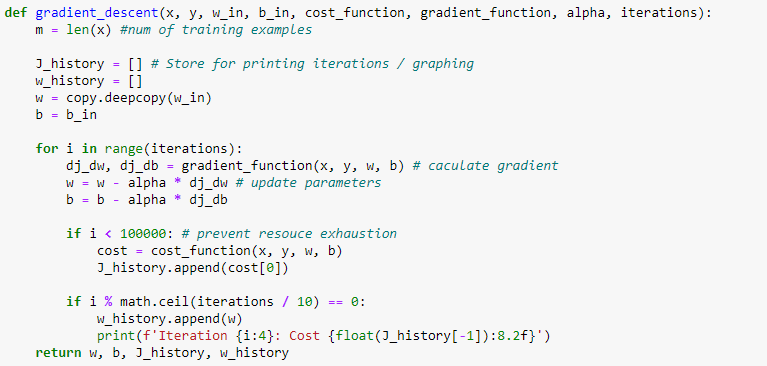
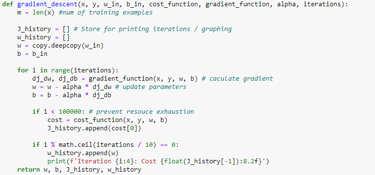
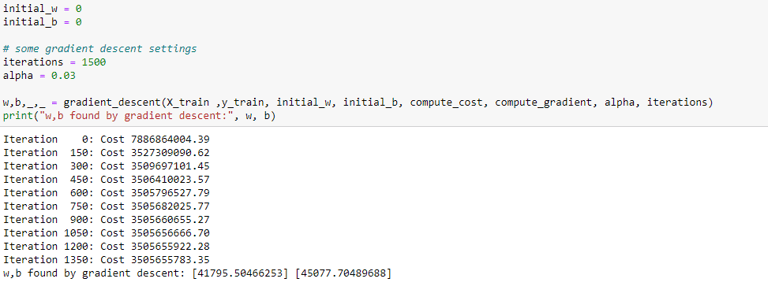
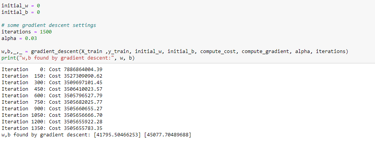
The w and b variables are exactly what we need to create an algorithm for predictng the value of a house.
Findings
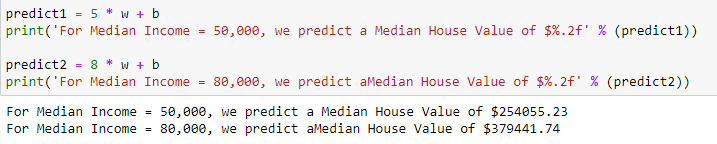
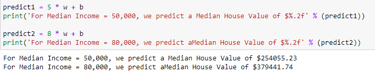
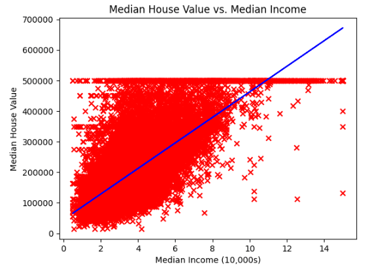
Now, all we have to do is plug in the median income and multiply it by the constants w and b and the result will be our prediction. The plot below shows our regression line along with Median Income and Median House Value. This shows that median income has a positive correlation with the median house value
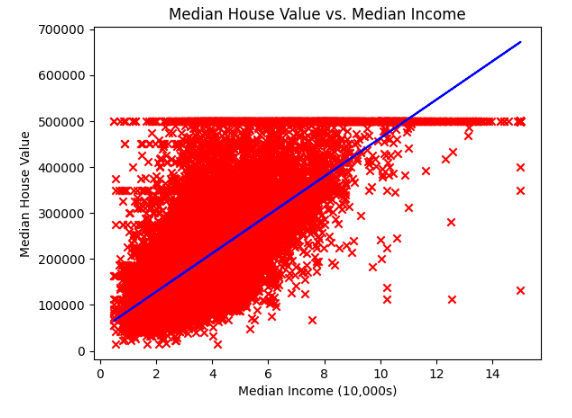
In this experiment we were able to compute the linear regression and algorithm to predict the house value based on current income. In the future I hope to further improve this experiment’s accuracy by adding more parameters or features so the prediction can be more applicable.
The full Jupyter notebook for this experiment can be found here.